Knowledge optimizer dashboard
Series: Knowledge optimizer for the knowledge workbench
Previous suggested step: Knowledge optimizer overview
Next suggested step: Optimize your knowledge base content
In the knowledge optimizer dashboard, you can view and analyze performance and high-level operational metrics for a selected knowledge base V2 or knowledge fabric configuration. You can also filter these results by specifying a date range or a configured touchpoint.
Select filter criteria
- Click Menu > Knowledge > Optimizer.
- Click the Knowledge Base / Configuration list and choose the knowledge base or configuration that you want to view. Note: You can select multiple entries of the same knowledge source type. The dashboard shows aggregate metrics when multiple knowledge bases or configurations are selected.
- To narrow your search to a specific time frame, click the calendar next to Start Date and End Date and select the dates.
- Select the touchpoint that you want to view:
- Knowledge base V2
- All Touchpoints (default)
- Knowledge Portal
- Knowledge app for Messenger
- Genesys Dialog Engine Bot Flow
- Genesys Digital Bot Flow
- Agent Assist
- Knowledge configuration
- Agent Copilot
- Knowledge base V2
Knowledge base V2 metrics
You can view these metrics for knowledge bases:
- All queries in a specific time frame and the breakdown, in percentages, of answered and unanswered queries.
- All answered queries in a specific time frame and the breakdown, in percentages, of the application from which the conversation originated.
- All unanswered queries in a specific time frame and the breakdown, in percentages, of the application from which the conversation originated.
- Top 50 articles, the frequency in which an article appeared in a conversation, and its feedback score, including positive and negative feedback counts.
- Top 20 answered queries and the frequency in which each answered query appeared in a conversation.
- Top 20 unanswered queries and the frequency in which each unanswered query appeared in a conversation.
For answered and unanswered queries, you can see the application in which the query appears:
- Knowledge Portal
- Knowledge app for Messenger
- Genesys Dialog Engine Bot Flow
- Genesys Digital Bot Flow
- Agent Assist
All queries
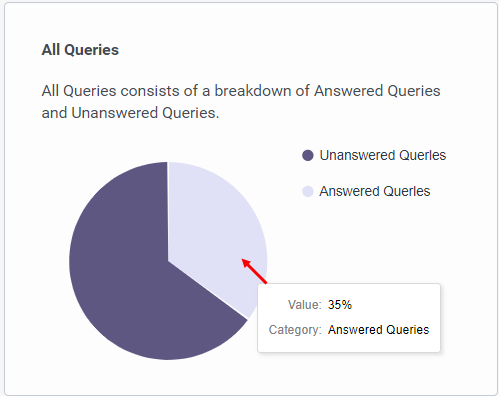
The All Queries tile displays a pie chart of the percentage of answered and unanswered queries. Hover over a section in the chart and see the value and category, answered or unanswered, that make up 100% of all queries.
Answered queries
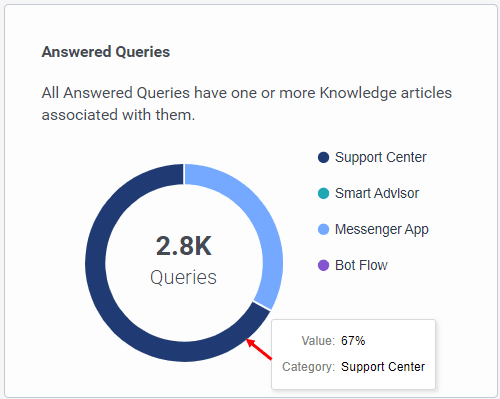
The Answered Queries tile displays the total number of queries that the bot answered and the application from which the conversation occurred. To see the percentage of answered queries for a particular application, as indicated by the color-coded labels, hover over a section in the chart.
Unanswered queries
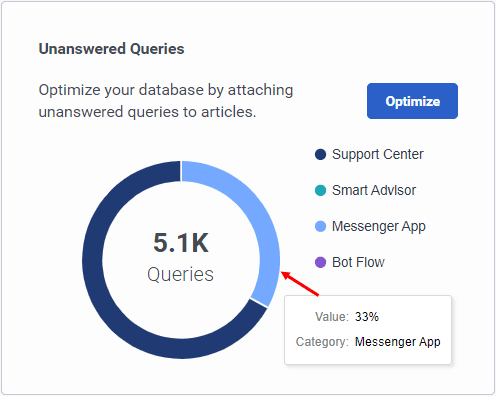
The Unanswered Queries tile displays the total number of queries that the bot did not answer and the application from which the conversation occurred. To see the percentage of unanswered queries for a particular application, as indicated by the color-coded labels, hover over a section in the chart.
From this tile, you can optimize your knowledge base.
Top unanswered queries
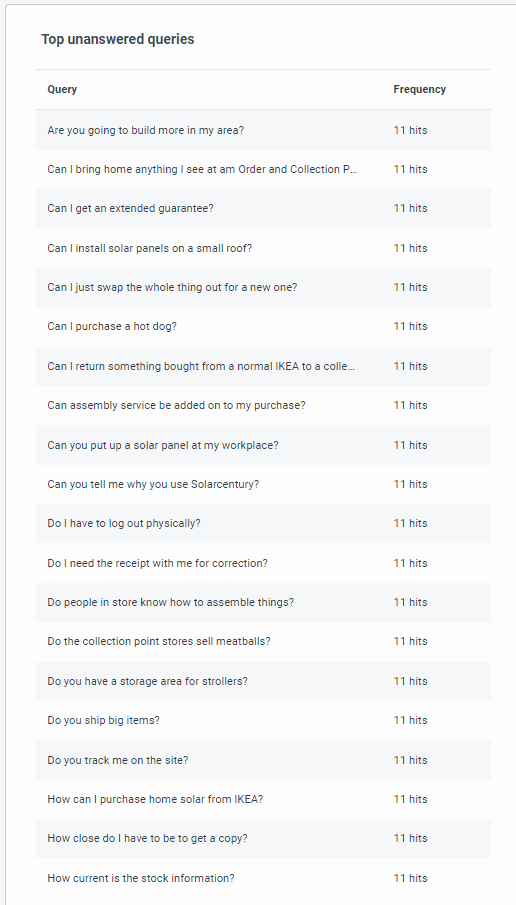
This tile shows the top queries, up to 20, that were not answered during bot conversations and the number of times in which each unanswered query appeared in a conversation.
Top answered queries
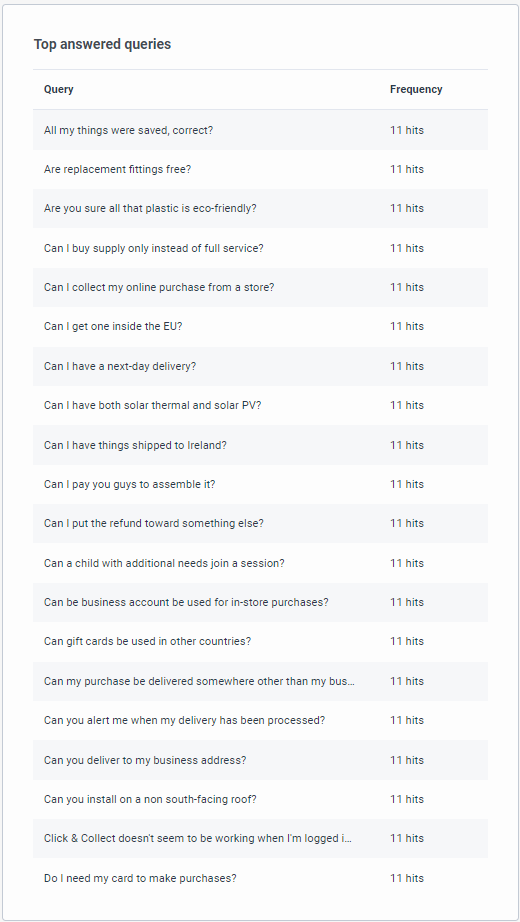
This tile shows the top queries, up to 20, that were answered during bot conversations and the number of times in which each answered query appeared in a conversation.
Top surfaced articles
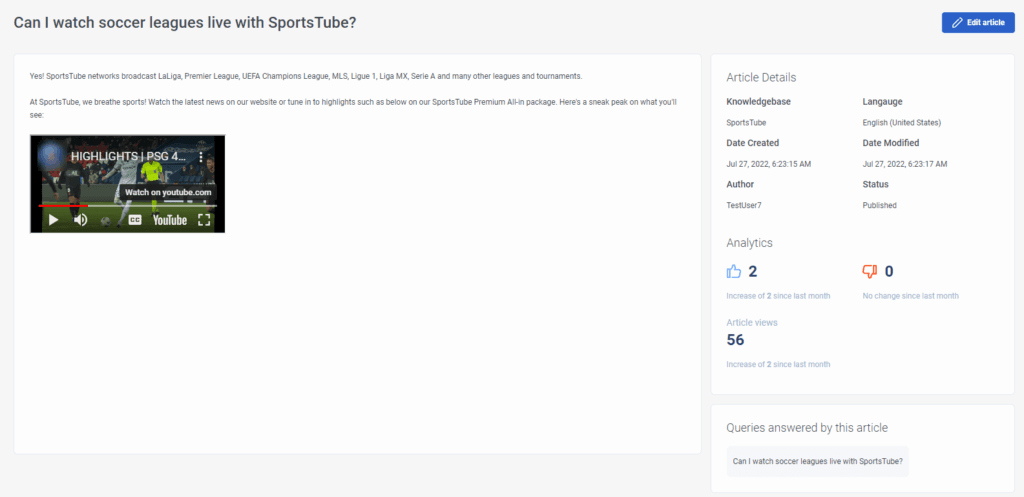
This tile shows the top articles, up to 50, used in the knowledge base within the specified time frame. The tile also displays the number of times each article was used in bot conversations, the last modified date, and the percentage of positive or negative feedback, including positive and negative feedback counts.
Click an article to open the Article View and see the article details, feedback analytics, number of views, and other queries that this article answered.

Knowledge configuration metrics
You can view these metrics for knowledge configurations:
- The total number of interactions in which the selected touchpoints generated answers from knowledge fabric content during the selected date range.
- The total number of feedback submissions, both positive and negative, that touchpoints received on generated answers within the selected date range.
- The count of answer generation queries that received negative feedback, indicating instances where the generated answer did not adequately address the query.
Total interactions
The Total interactions tile shows the total number of voice and digital interactions in which the selected touchpoints generated answers from knowledge fabric content during the selected date range. This metric provides administrators with a baseline volume of answer generation activity, helping them understand the overall scale of usage before drilling into feedback trends or specific query issues.

Total feedback
The Total feedback tile shows the the total number of feedback submissions, both positive and negative, that touchpoints received on generated answers within the selected date range. This metric helps administrators gauge how actively users are engaging with the feedback mechanism, providing context for interpreting feedback scores and identifying whether enough feedback volume exists to draw reliable conclusions about content performance.

Queries with negative feedback
The count of answer generation queries, up to 50, that received negative feedback, indicating instances where the generated answer did not adequately address the query. This metric allows administrators to pinpoint specific problem areas, review query details such as generated answers, sources, and touchpoints, and identify knowledge gaps or content issues that need attention.
Click a query to open the Query details panel and see more query details such as queried date, suggestion, whether copied by agent or not, whether context search was enabled, and the conversation ID. It also shows the generated answer and sources that were used to generate the answer.


[NEXT] Was this article helpful?
Get user feedback about articles.