Data Actions Performance Summary view
The Data Actions Performance Summary view displays current and historical metrics and data about data actions. For more information, see About the data actions integrations.
Available columns
To view the available columns, see the Data Actions Performance Summary view section in the View available columns in performance views by category article.
- To view the consolidated list of available columns in the performance views, see Consolidated view of available columns in performance views.
- To view the list of available columns in the performance views by category, see View available columns in performance views by category.
Set a default time zone in the workspace
You can set the default time zone in the analytics workspace before viewing any analytics view.
To set the default time zone in the workspace, follow these steps:
- Click Performance > Workspace.
- Click Menu > Analytics > Analytics Workspace.
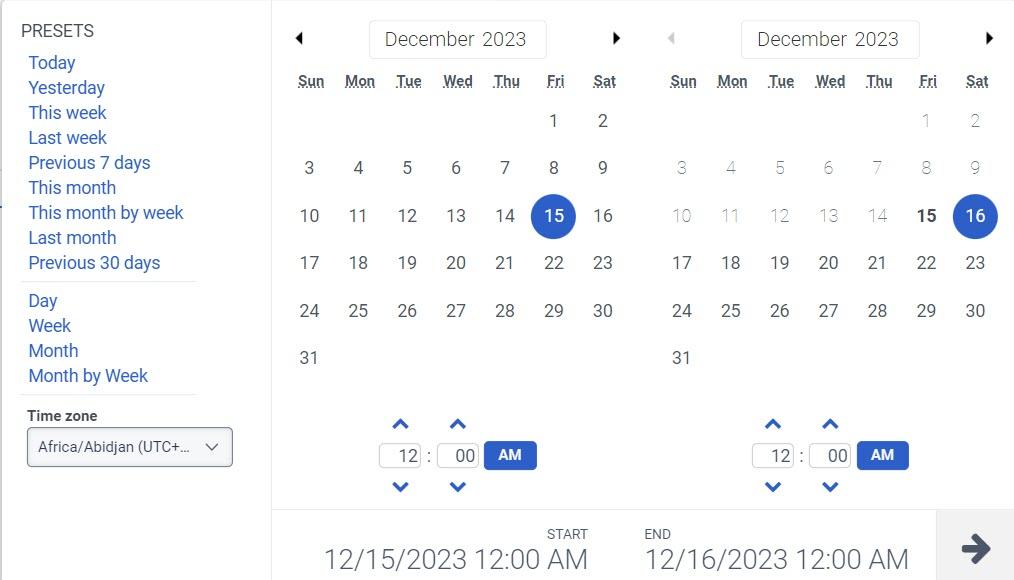
- On the left side, from the Time zone drop-down menu, select the required time zone as the default time zone for the analytics workspace.
| To | Actions |
|---|---|
| Display the view | Click Performance > Workspace > Other > Data Actions Performance.
|
| Filter by category | On the upper left, click the Filter user(s) search icon . Enter a category name. The suggested names appear in the search results. |
| Customize the view using interaction filters | On the upper right, click the Toggle filters panel icon |
| Modify the columns that appear in the view | See show, hide, and rearrange columns below. |
| Refresh the view | To display the most current data, click Refresh . |
| Save the view with your filter and column settings | Click Save . |
| Export the data in the view | Click Export . |
View statistics for a specific data action
To see data for a specific data action, in the Action category row, click . The data actions associated with the action category appear under the category row. For more information about a specific data action, see the Data Actions Performance Detail view.
Customize the view
To show only certain data, customize the Data actions performance summary view using any combination of filters.
- The Data actions performance summary view shows the data only when the applicable data is present. The view only shows what has happened. If nothing has happened, the view remains empty.
- Under certain conditions, the data action metrics do not include the integration ID, such as when the data actions reach internal limits, including the maximum number of requests per minute, the maximum number of concurrent action executions, or the maximum number of concurrent action function invocation executions. As a result, the data action invocations are reported as Other. For more information about the limits, see the Genesys developer center article.
| Filter | Description |
|---|---|
| Response status | A list of observed HTTP status codes that are returned in response to data action execution. The list varies depending on what is observed within the dataset. |
[NEXT] Was this article helpful?
Get user feedback about articles.
